
Help / Product guides / Analytics / Dashboard and Analytics
Dashboard and Analytics
Your headline numbers for the period you choose.
Last updated
Dashboard
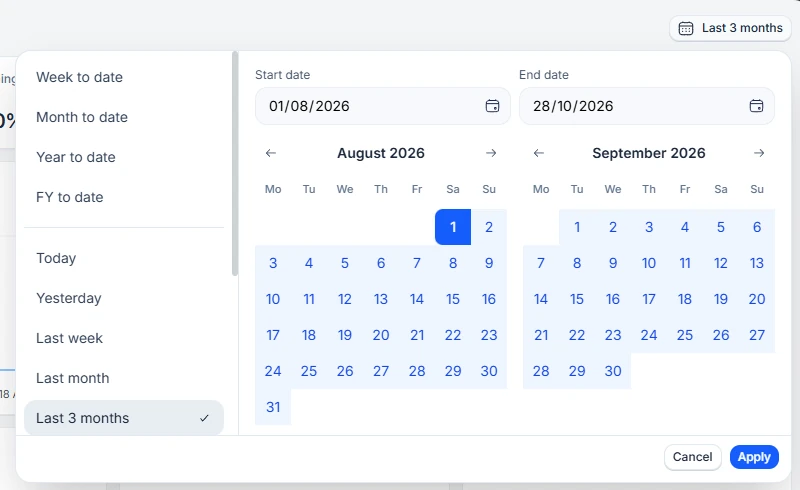
Dashboard opens on the last 30 days. Choose a date range, and it is remembered for you. Click Total sales, Invoices, or Customers to chart that figure, and switch between a line and a bar chart. Tiles such as Out of stock, Today’s deliveries, Deliveries pending, and Deliveries On-Hold link to Inventory and Delivery.
Analytics
Analytics opens on month to date. Pick a preset such as Week to date, FY to date, Last month, or Last 90 days, or set a custom range.
The widgets shown on Analytics are set by your role. An admin chooses them under Analytics dashboard when creating or editing a role on the Team tab in Settings.